MM-2018_W50
Lessons Learned: MakeoverMonday_2018_W50
(MM...); http://www.makeovermonday.co.uk/
FYI: on MM;
"Makeover Monday is your weekly learning and development appointment with
yourself and hundreds of passionate data people. For free! Join us every
Monday to work with a given data set and create better, more effective
visualizations and help us make information more accessible.The Makeover Monday
community comes together every week from around the globe and we would love for
YOU to become part of it, too. (this was copied from the MM website
above)."
When I look at all
the other viz's submitted I always feel like mine are from pre-school compared
to the masters degree students out there. But one has to start somewhere right,
so I push myself to work at it and put it out there. I by no means think
my viz's are good or really worthy of being published, so note that as you look
at some of my work at this point. Link to my
public page;
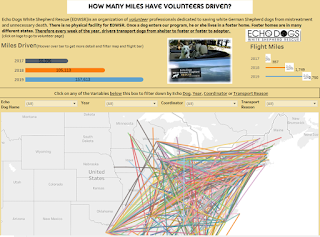
Week50; This week's
dataset was about Land Use by Food Type. It really was a simple data set that
did not need much work in terms of pivoting the data etc. I did do one
manipulation (See below).
Data and original viz; https://data.world/makeovermonday/2018w50. The data was in Land use per Square Meters.
In the US, we tend to use miles as opposed to Meters so I added another column
with the Miles calculation (Metres*3.861)
Weekly Learning Aspects; The items I wanted to
learn this week were set actions (delivered in 2018.3) and doing
something with an image behind the viz.
Lessons Learned;
1. Images: Couple of things I struggled with
when trying to add the image.
b. use a x and y axis
on your image (inspiration; Story by Data; Kate Strachnyi)

d. Make sure your background
maps are set to none as images are delivered in tableau(so you don't get the
map navigation icons)


2. Just a note about
the next step (not necessary a lesson learned). I created a standard side bar
chart with my miles\metres conversion on it as a parameter to drive the set
actions. I put the parameters in the title.
3. Sets;
Background;
a. For my set action; I wanted for interactivity based on the food type chosen
and look at it as % of total. So when someone Control + Clicked on the viz,
they could see how those pieces affected the whole piece of the pie.
(NOTE below Andy's opinion on this for this week's data set)
a. I created a pie with the set in the color mark in the sheet.
b. in the dashboard; I then added the Set Actions

c. The set
action is driven by the Bar Chart and applies to the pie chart

Lessons Learned; (Sets); your set must be created and sit on a
viz before it can be used in a Dashboard action.
Inspirations (whom):
3. Set
Actions; Linsey Poulter; Public
Page (you will notice there are many pages of
instruction on this page)
Session Feedback/Notes:
1. Data Set is NOT a piece of the whole; In this weeks session ; Andy
Kriebel talked about NOT using pie, doughnut or waffle charts or
anything that looks at the data as a piece of the whole. The data is not
associated and thus should not be looked at that way. So my pie chart
(and use of set actions) should be removed from my viz. Many times we
need to step back and look at the data by itself before starting to deign.
2. Andy noted that
my image just cluttered things up and that should be removed (but at least I
learned by initially using it).
3. they mentioned
taking away my hand image (that I created as a symbol in a chart with tooltip)
as the new button functionality wasn't working great for me.
4. Andy said over
and over again that we need to
cite our images and icons. He mentioned that this is something
that they repeat at every session.
** MM
panelists (Andy Kribal & Carl Allchin) said Scott Kimley viz (see below)
seemed to capture the best in terms data and understandably. @ScottKimly. Here is the
recorded link to the webinar
if you want to review the whole hour.

This was my 1st
iteration;

AND, here's what I
ended up without the image in the background. I kept the pie as I liked using
that for set action and my learning. There are many things I still would
like to learn, like how to add the titles to the pie chart, collapsible menus,
more with set actions, the new buttons... on an on an on!

Comments
Post a Comment