Posts

Showing posts from January, 2019

MM_2019_W04; Rabbit chasing | Formula's | Great Resources

Image
The proverbial Rabbit hole;   This is my dog chasing a squirrel (we'll say a rabbit for this post though :-) This week, I went down a rabbit hole (def; To enter into a situation or begin a process or journey that is particularly strange, problematic, difficult, complex, or chaotic, especially one that becomes increasingly so as it develops or unfolds) .    I typically try to start with my own thoughts but also keep in mind that I want to learn new topics.   So as folks post to #MMVIZ review;I  think, oh that would be good to learn.   But what I learned this week is don't take on more than you can handle.   I started down a path with something that at this point was a bit above my head.   @r_headington had a great viz he posted that looked at using Zooming-in and sliding on a time-series in Tableau. He took his inspiration from @canonicalizedco 's blog post canonicalized.com/zoom-slide-tab… but changed the slider to set actions. Here is his final viz . I worked at br
MM_2019_W03 | Hex Maps | Adding Color Pallet | Highlight Bars in Chart

Image
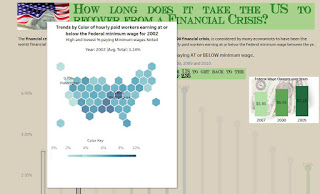
Hex Maps | Adding Color Palette | Highlight Bars in Chart  This week we'll talk about these topics. How to do I go about approaching the topic and my direction. Lessons learned Resources How do I approach the Topic; Learn from others\refresher; I have to be honest, because I am so new to Tableau and want to learn as much as possible as I am working on my weekly viz's, I often look at others and see if something resonates with me.   Eva and Andy have been talking about keeping things simple lots lately so I try to focus on that when I look at other's viz's.   I also either try to pick at least 1 new learning lesson (easy to do at this stage) or something I haven't focused on for a while for a refresher. Sketch out what I am thinking ; yep, I try an jot down what I am thinking on paper. Many times it takes different directions but I think it's important to at least start wit

MM_2019_W02: Heatmap and Viz inside Tooltip (more)|

Image
Makeover Monday; week 2 was focused on Freedom of the press; The viz this week is an  heat-map showing progression of data over 24 years by country and years using Viz inside of tooltip to show 2 different worksheets (see below) Viz;    Viz inside of Tooltip; essentially did 2 charts within the tooltip. 1 st Chart Tooltip ; looked at the %age breakdown of the status for the time period using a table calculation which was % of total. 2 nd Chart tooltip is a dual axis chart using a bar and a circle to indicate scores with the Sum (total Score) inside of the circle. The circles do not show (see end result below) because it is essentially just the sum (total score) as text and the status as color.  So you get a comprehensive view just by clicking on the heat map box. This is the syntax in the tooltip text pill; Historic Press Freedom Split & Score 1994-2017 for <Country> <Sheet name="Tooltip %'s" maxwidth="500&q