New Years; New ‘Goals:keeping up with the 'side gig'

I am trying to get back into Tableau and keep my skills
fresh while doing some other things with my career and job. So, getting back
into Tableau had been fun, albeit a little time consuming. My goal is to publish
every other week and absorb the MM webinars weekly. This will give me a little breathing room for
work while still keeping in the field. I have been keeping up with the weeks but this is my first lessons learned post. I hope to go back to the previous weeks and talk through lessons learned as time permits. Week1 was a big struggle for me but a very fun one so stay tuned!
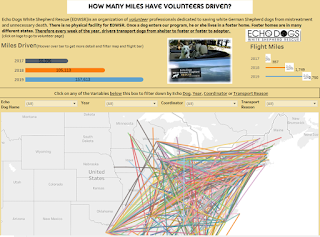
MM_W5, I really wanted to learn how to do a negative bar
chart. This is in essence displaying a set of data in bar but show it against a
colored background to help the reader understand the data visually against
100%. I believe this has a stronger
impact than just a standard bar chart.

Lessons Learned:
Dual Axis; To do this
type of chart you need to do a dual axis as 1 will be your number and the other
will be against 100%. You need to make
sure to have your Axis match up (I had to fix the 2nd axis to go from
0-101 as it automatically wanted to go to 51 in this example)
Agg Min Formula; the min(100)
in the Column pill allows the bar chart to always stretch to 100 so all bars
are even.
Header; I really
like using power point to create my header because I like to use fonts that are
necessary supported with tableau public.
By creating the title as an image, you don’t have to worry about the
right fonts being available or having them on your server. In the below image;
I was able to go grab some cool James bond type font (great site for free fonts:
(https://www.fontspace.com/)
Tableau Public Link

Comments
Post a Comment