MM_2019_W6 | Makeover Monday recording key points | Couple 'other greats' this week
MM_2019_W6
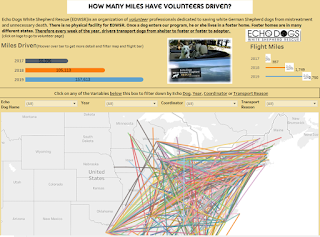
This week there was
very basic data so really just kept the viz simple. I just created 3 bar inside of bar charts and
then presented a title about each of the data points. The formulas were pretty straight forward in
the viz's.
Two story points
that Eva and Andy consistently talk about both in the MM reviews as well in their #MakeOverMonday
book are keep the dashboards simple (I think people struggle with doing that) as well as tell the story.
There definitely were some favorites of mine as I looked at some of the
submissions this week but sticking to the simple was my mantra for the week.
During the
#MMVizreview; Andy and Eva did a demo at the end. At about the 1:04 mark; Eva shows how to do a
simple Bar inside of Bar chart. After
that Andy reviews BAN (big (*& numbers), which I think is always helpful.
So take a listen here
even if you just go to the 1 hour mark.
Here are some of my
favorites for this week;
- Nathan Adams; nice representation of BAN's, Waffles and bar. I like how he used different ways to represent that data.
- Brian Scally; love the firecracker type design and nice and simple
- Anna Foard; Anna consistently tells a great story and I really do like waffle charts in general.
- Katie Bridges did a really cool thing by making the viz look like a pamphlet or infographic and told a great story


Here's a link
to my viz but pretty boring this week.

Comments
Post a Comment