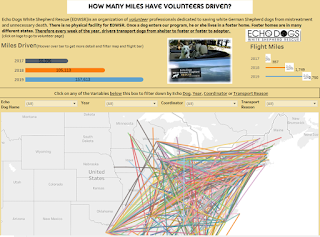
MM_Week24; Basic chart drawing the reader to my points

Here is a little background on the above chart and some background on some of the things I had to think a bit about as I built. Tableau Public Viz
·
Year Change (
o
FORMULA: FLOAT(LEFT([Year],4))
o
What it does; year was combined like
this; 2018/2019 so the formulas took the last 4 digits of the year
·
Formula for Boys/Girls difference Since 2002
o
FORMULA; (ZN(SUM([Girls Participation]))
- LOOKUP(ZN(SUM([Girls Participation])), FIRST())) / ABS(LOOKUP(ZN(SUM([Girls
Participation])), FIRST()))
o
What it does; took the numbers and
evaluated the comparison from 2003 to the next year always going back to 2003.
o
Pieces of the formula;
§ ZN;
ZN tests to see if a function is null, and if it is,
it will return a value of zero
§ Lookup; LOOKUP function that allows you to look up and down
a partition of rows and return the value in that field by specifying an offset.
In the formulas example, we are looking up the FIRST Value
§ ABS; This function returns the absolute value of the
specified number.
o
Data:

·
Boys Soccer Change Formula (must group
sport first)
o
IF ATTR([YEAR])=2018 AND ATTR([Sport
(group)])='Soccer' THEN [Girls Difference Since 2002 ] END
·
What is does: helps with this formula that it ONLY
attached to the Soccer attribute so it can be isolated by itself. (NOTE the
Track and Field does not have a # associated to it so we can point the reader
to the one attribute)

·
SPACER
Formula: IF ATTR([YEAR])=2018 AND
ATTR([SPORT])='Soccer' THEN ' | ' END
What it does: only displays a | if it passes 2018/Soccer
sport
·
I then manually created some sets for my top 5
sports
·
Global Format on Girls/Boys Soccer Change; +0.0%;-0.0%
·
Added ATTR(Year) (delivered year); ATTR([Year]) to
DETAILS
o
What is Does: Drop a
dimension on Detail on the Marks card to separate the marks
in a data view according to the members of a dimension. Unlike dropping a
dimension on the Rows or Columns shelf, dropping it on Detail on the Marks
card is a way to show more data without changing the table structure.
o
Without the Year on the Marks – Detail card;

o
This is what is looks like added (so I’ve allowed to change the most granular place where an analysis takes
place)

·
Label (at ends to only show top)

TEXT: <SPORT><AGG(SPACER)><AGG(BOYS
SOCCER CHANGE)>
What it does: displays
sport the | (if 2018 and soccer) and the Soccer change (if 2018 and Soccer);
else null
All other items are just formatting things.
Thanks for reading.. hope it helped!

Comments
Post a Comment